
Interactive Installation and Data Performance at FestTech Festival

The Goal
AkademiaDev’s unique expertise lies in the impactful visualization of large-scale data. We transform complex information into clear, interactive systems. The project’s aim is to demonstrate the studio’s technological and design capabilities while strengthening its position as a leader in interactive visual solutions for large and medium-sized businesses, as well as public authorities in Russia. For us, it was important to show that data is not just numbers — it is a way to see and understand the world.
The Idea
The core creative concept was based on the idea that the entire world can be represented as data. From data emerge the starry sky, the rhythm of a favorite song, the cities we live in, and even ourselves. Simply talking about the advantages of data visualization was not enough — the idea needed to be broadcasted through an engaging interactive format. We wanted every festival visitor to experience how familiar objects transform into data.
We developed game mechanics that allowed visitors to become part of the data stream and created a Naked Eye video accompanied by a TED-style talk presentation.
Installation «Digital Reflection»
In the museum lobby, we installed «Digital Reflection.» Each visitor could obtain their own real-time digital twin and download a video via QR code. To activate the mechanic, visitors had to smile at a camera placed next to the screen. At that moment, a YOLOv11 neural network configured for smile detection captured the emotion and triggered activation. A photo was taken and stored in a separate folder. The smile-based mechanic ensured that every interacting visitor was photographed. A couple hours later, these images were used in the digital performance described below.
After activation, a digital twin appeared on the screen. Using an Azure Kinect DK camera, a point cloud and depth map of the visitor were generated. Based on this data, a real-time 3D render of the digital reflection was created through a Point Relax simulation. The essence of the Point Relax simulation lies in mutual repulsion forces between points, similar to equally charged particles (for example, protons). Each point «feels» nearby points and moves away from them. We used a Point Relax simulation line mechanic: particles formed flowing lines that followed the user’s movements, creating a fluid digital image. At the end, each participant could download a unique 20-second video via QR code and take their digital reflection with them.
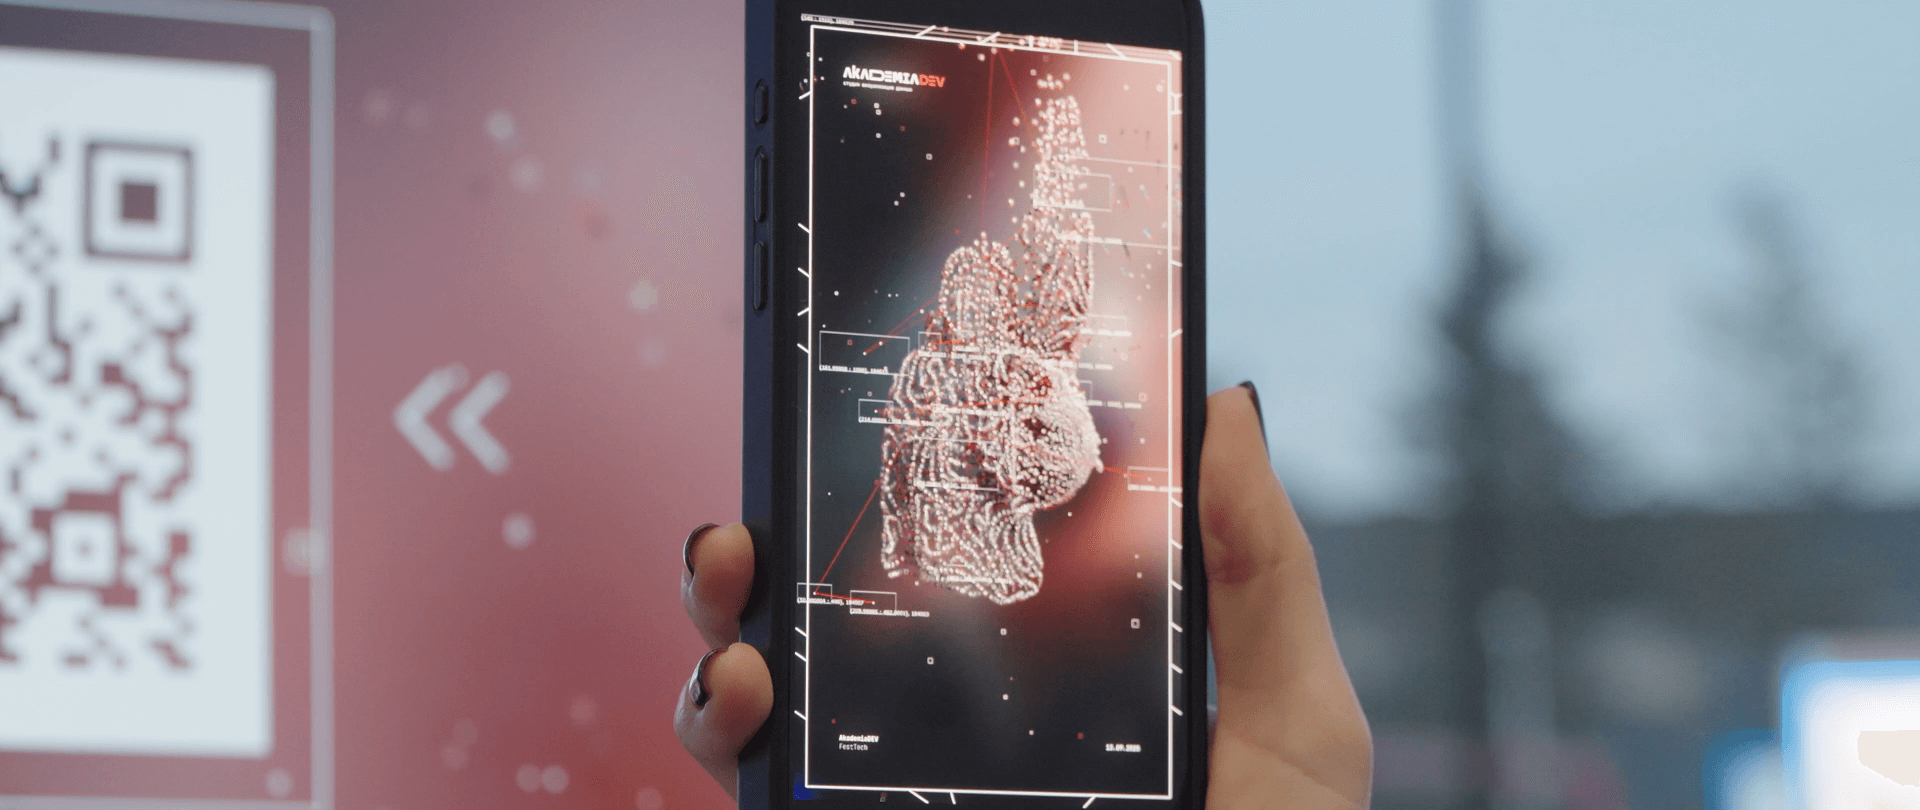
Through careful render refinement and setup configuration (including lighting, materials, and depth of field), we achieved high-quality real-time graphics. Within just a few hours before the performance, the installation was activated 342 times and became a major attraction of the festival.
Data Performance
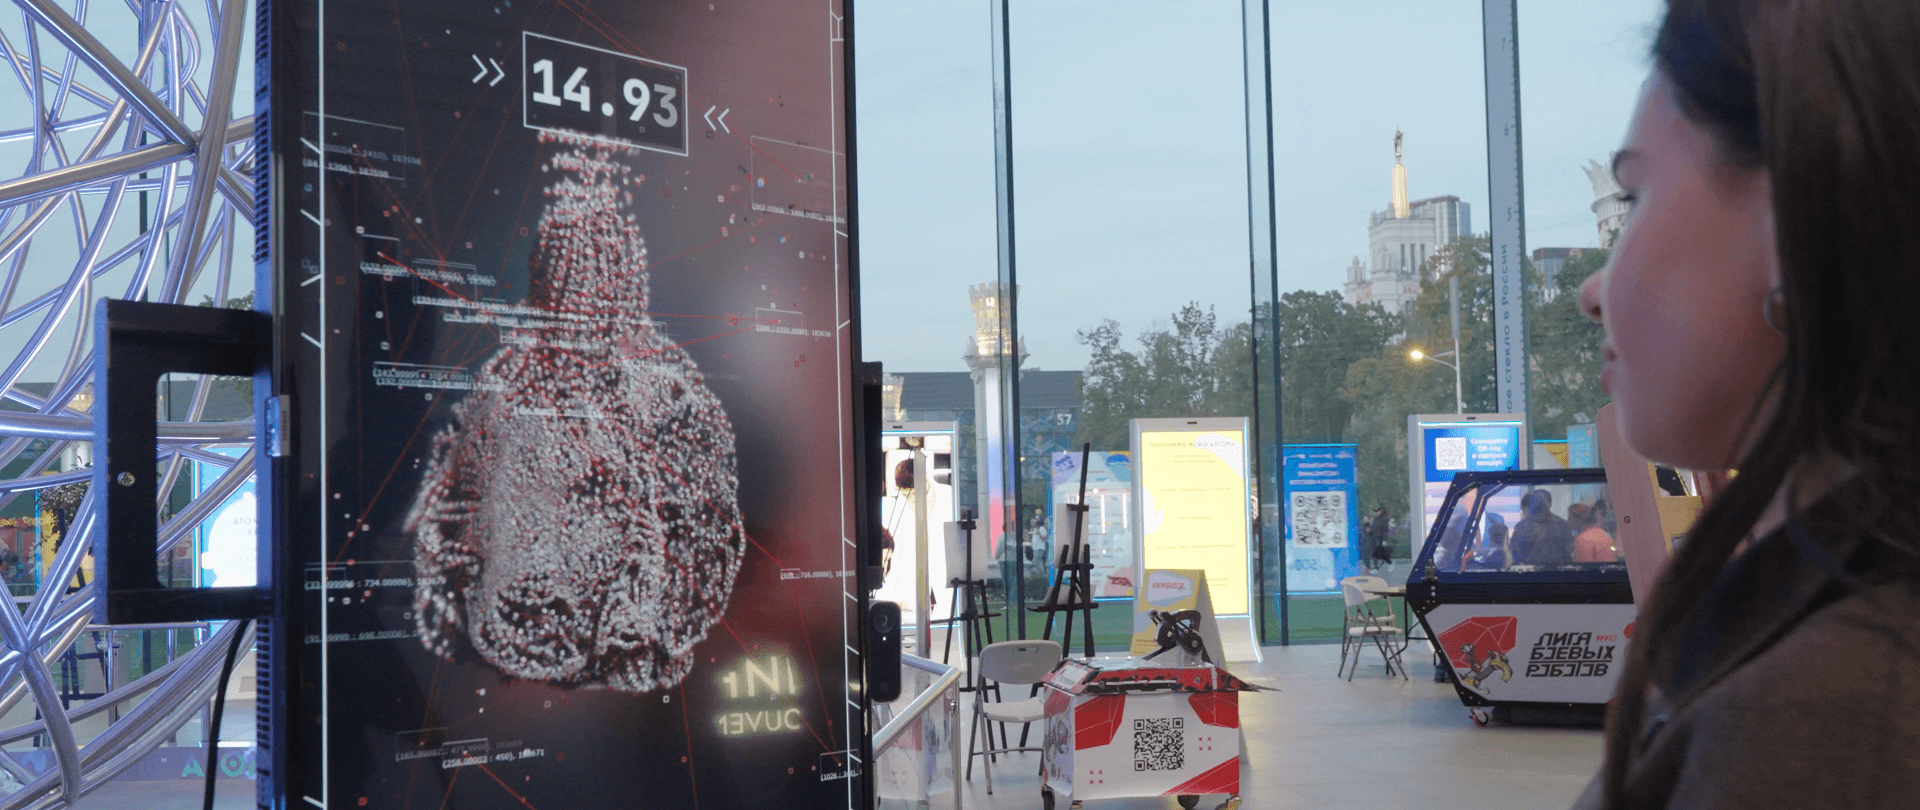
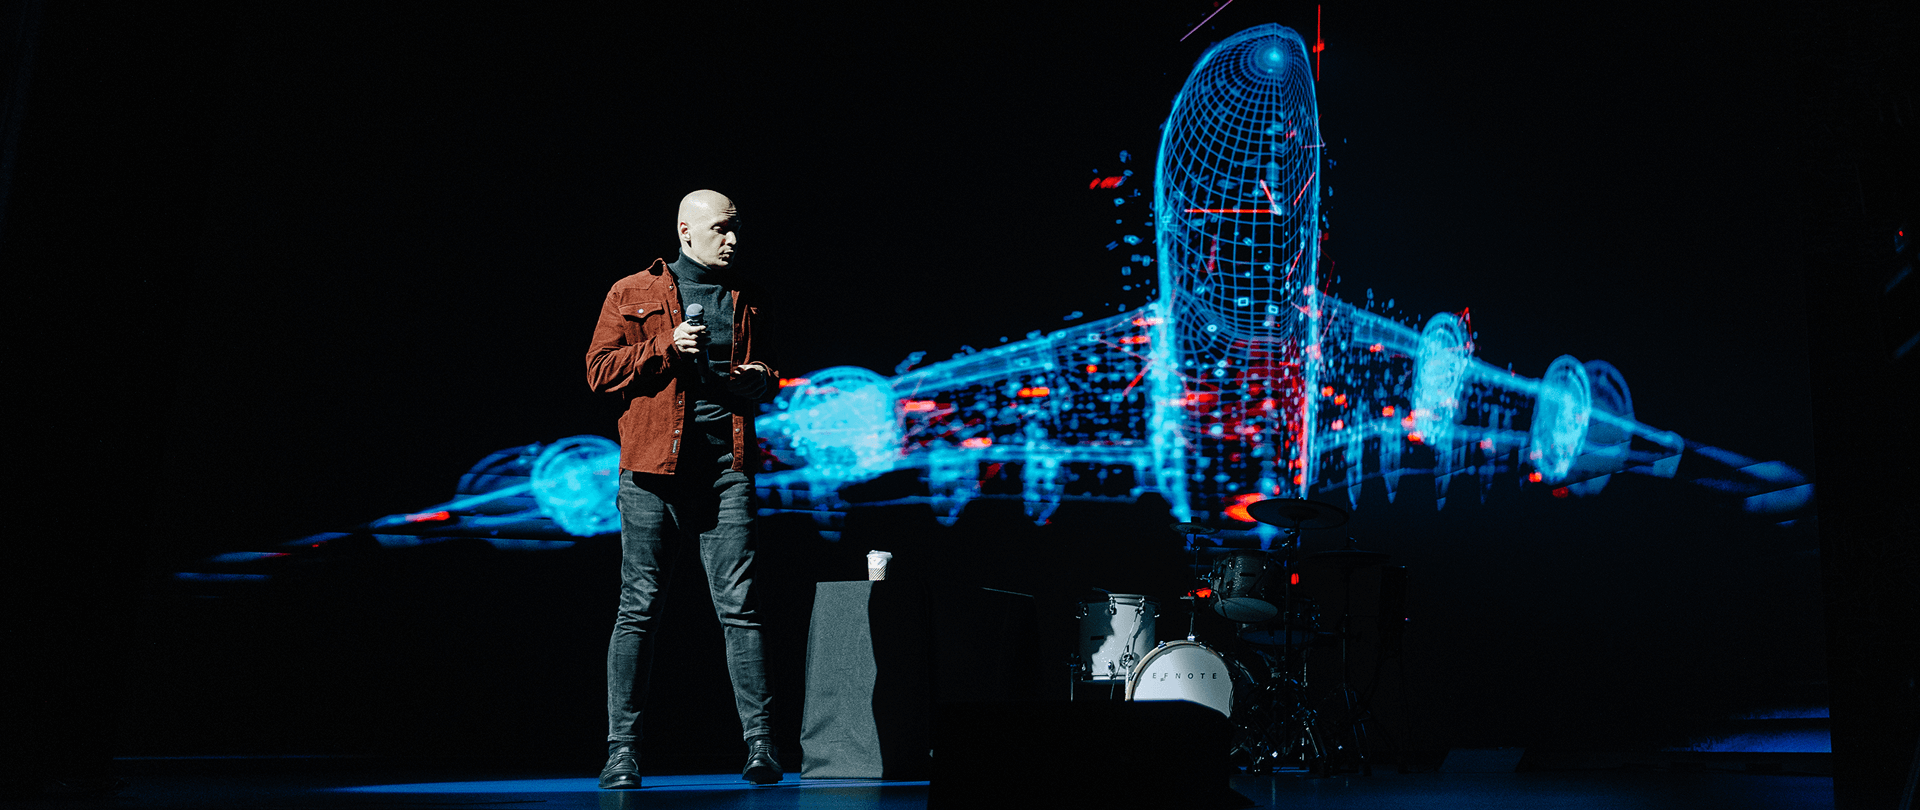
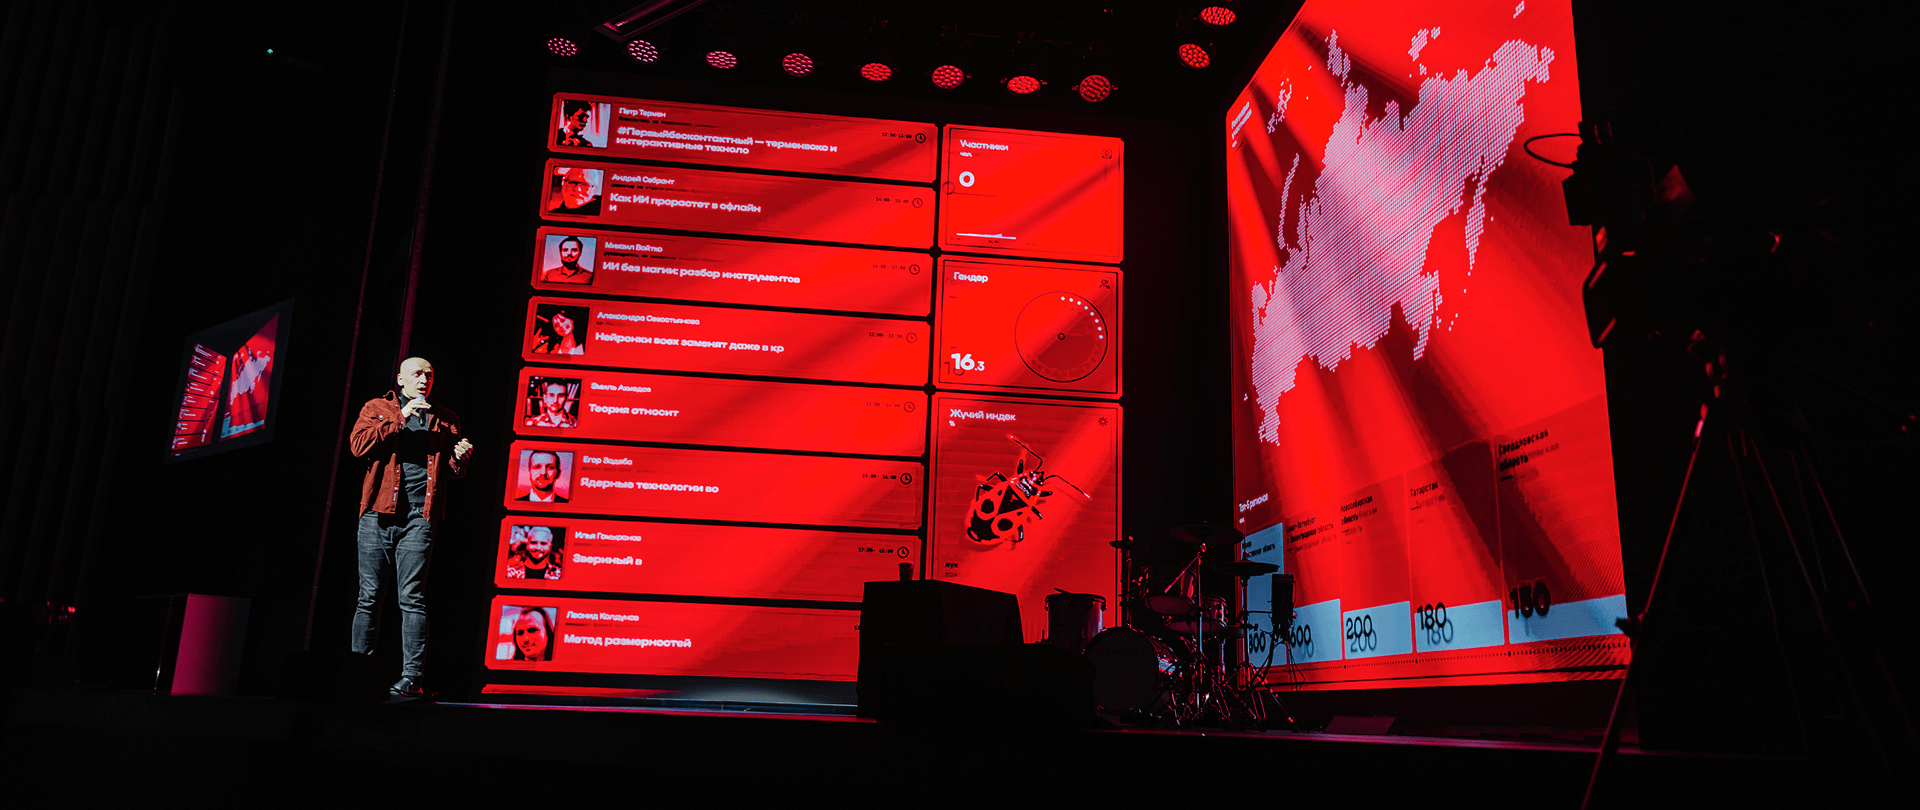
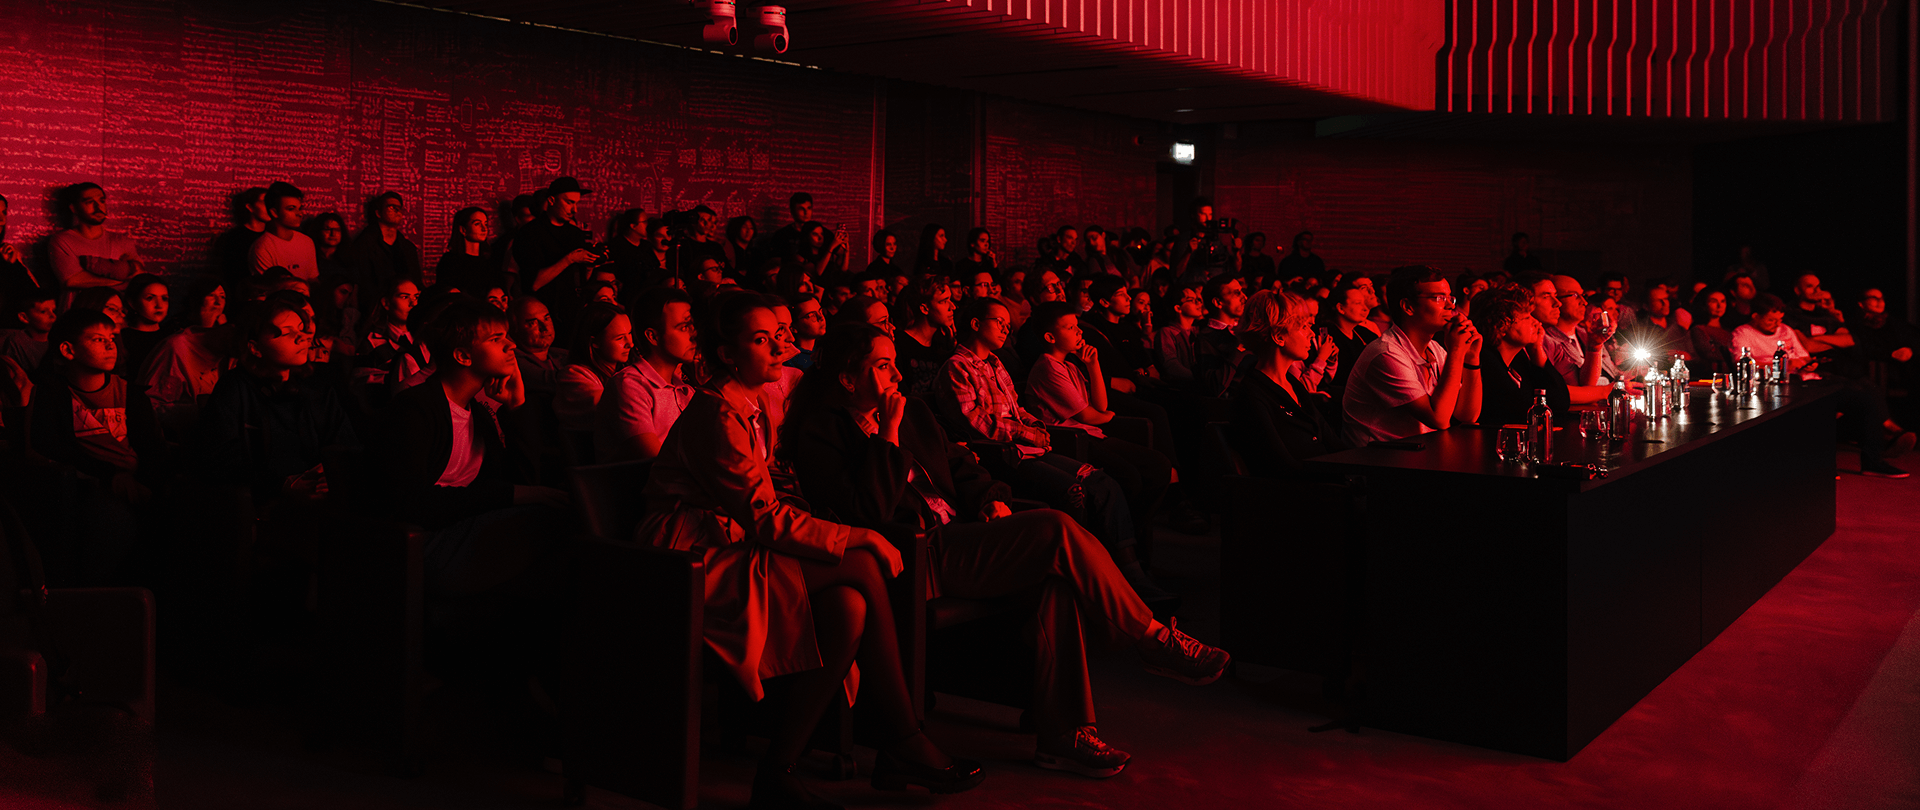
The second part of the project was a 3D data performance with a Naked Eye effect that opened the evening lecture program in the museum’s conference hall. On a massive 4800×2160 LED screen, complex ideas were conveyed through striking 3D visualization. Guests witnessed how everyday things — from a morning cup of coffee to an airplane flight and even the Earth itself — transformed into measurable and comprehensible digital forms.
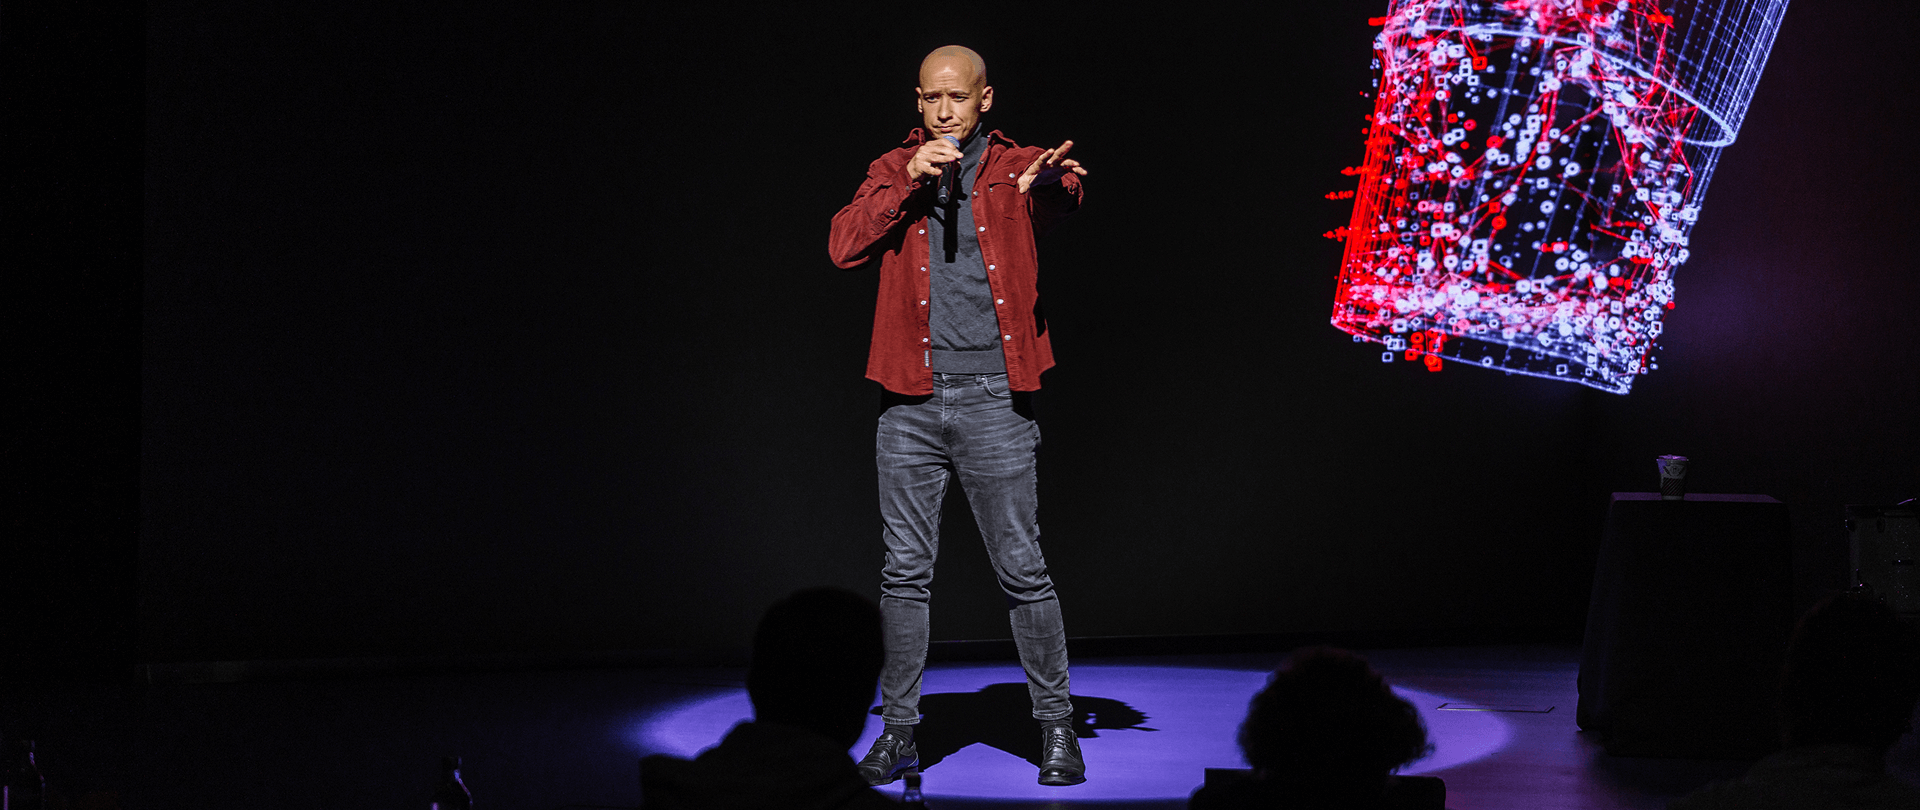
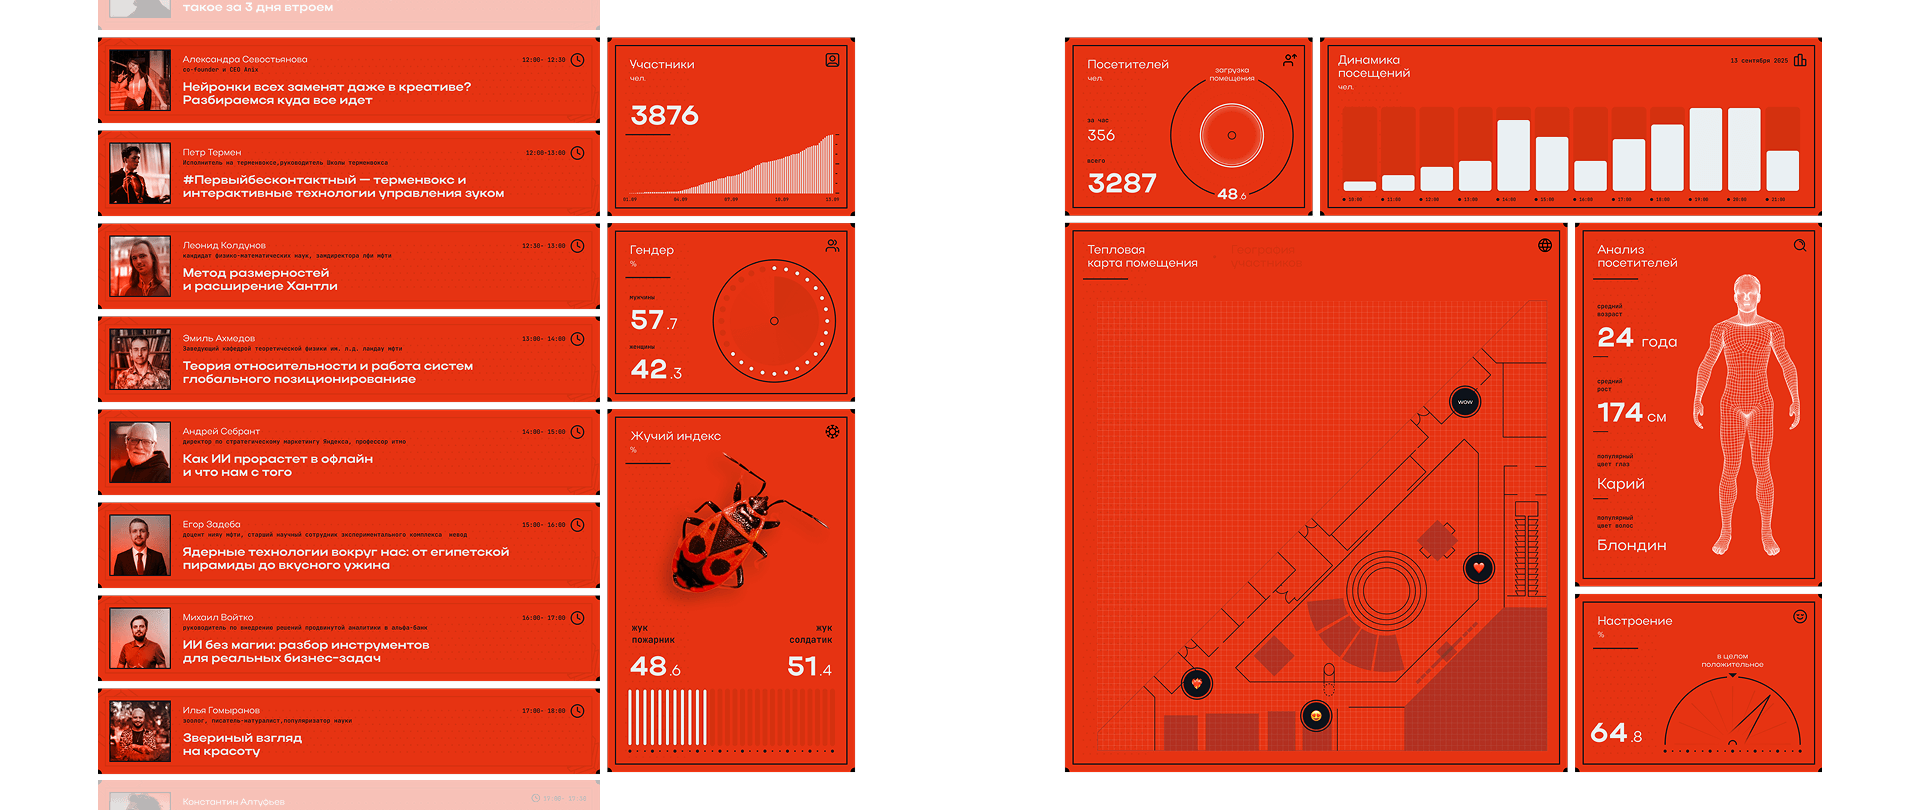
The video was accompanied by a live talk by Andrey Rodimtsev, Head of Projects at AkademiaDev. He spoke about how data shapes our understanding of the world and why high-quality visualization allows us to comprehend it better. In the second part of the video, a dashboard emerged on screen. The presented theses were supported by real open data collected about festival visitors — for example, the cities they came from and venue occupancy rate throughout the day.
The animation in the first part was familiar to our team — we already had established particle rendering mechanics. Implementing the volumetric dashboard, which had to look like a physical structure, was much more challenging. It was our first experience creating this type of visualization, and we had to search for and test new solutions directly during production.
Nikita Plyukhin
Art Director, AkademiaDev
The initial dashboard was designed in Figma, then divided into separate blocks. We created a 3D scene in Blender and animated it to appear volumetric, adding soft shadows and natural lighting.
The presentation concluded with an audiovisual performance: Andrew played electronic drums while a stream of visitor photos — collected throughout the day via the installation camera — flowed across the screen. The animation was generated in TouchDesigner in real time and reacted to the rhythm of the music. In the final scene, the photo streams assembled into the shape of a DNA strand. The performance demonstrated how much data can be collected and visualized within just a few hours with the help of modern technologies.
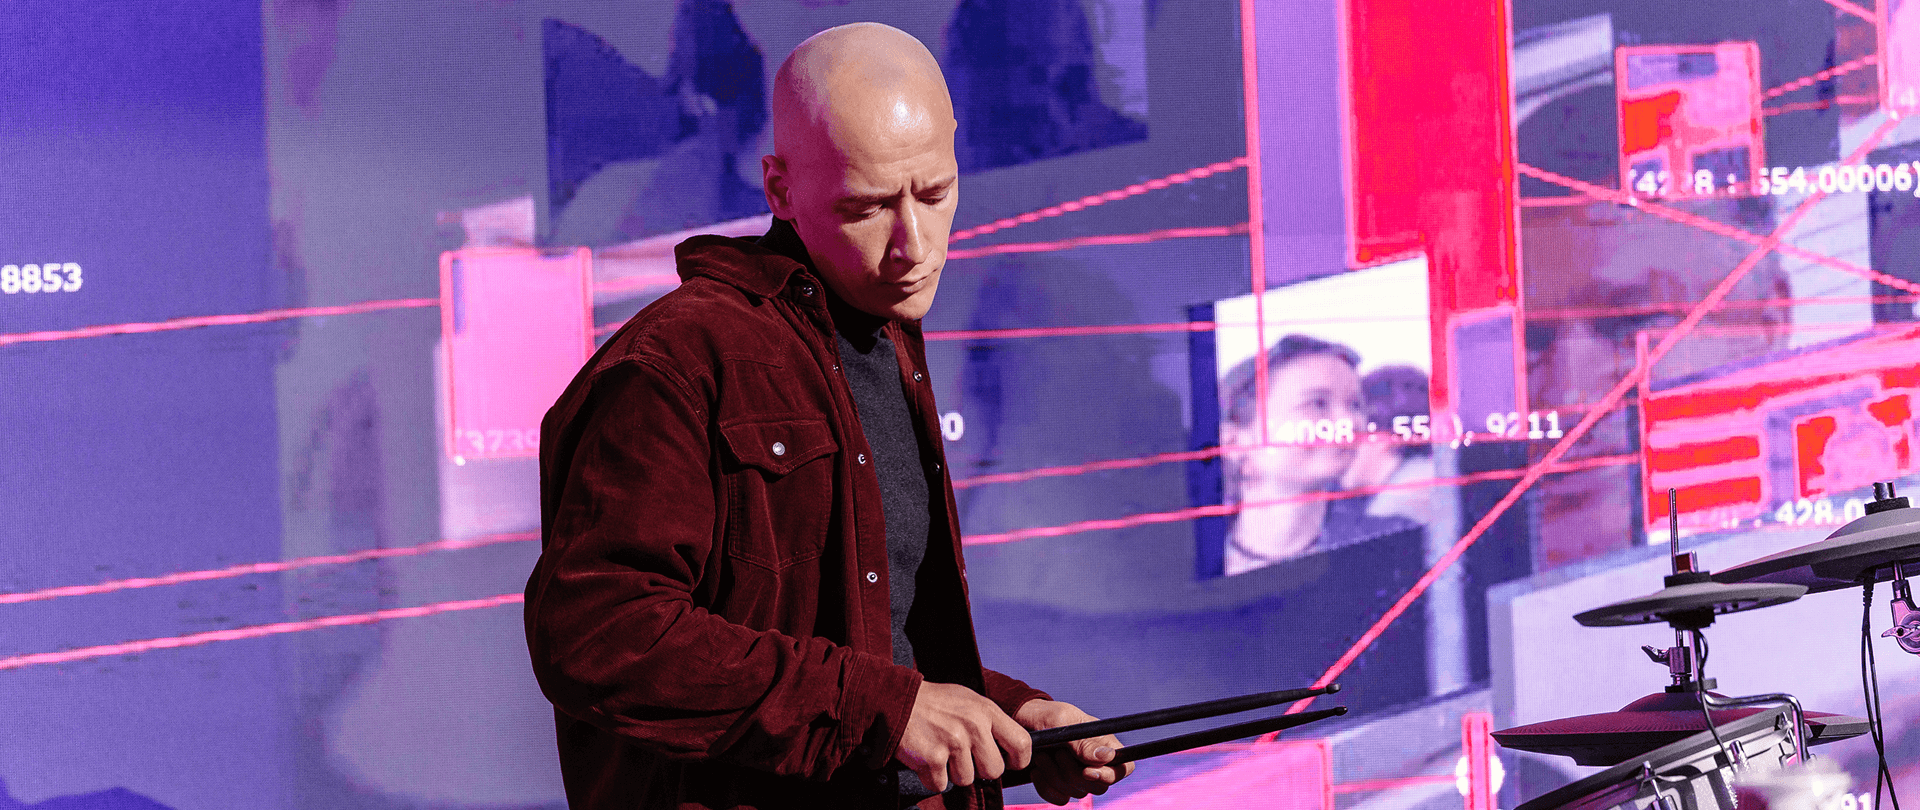
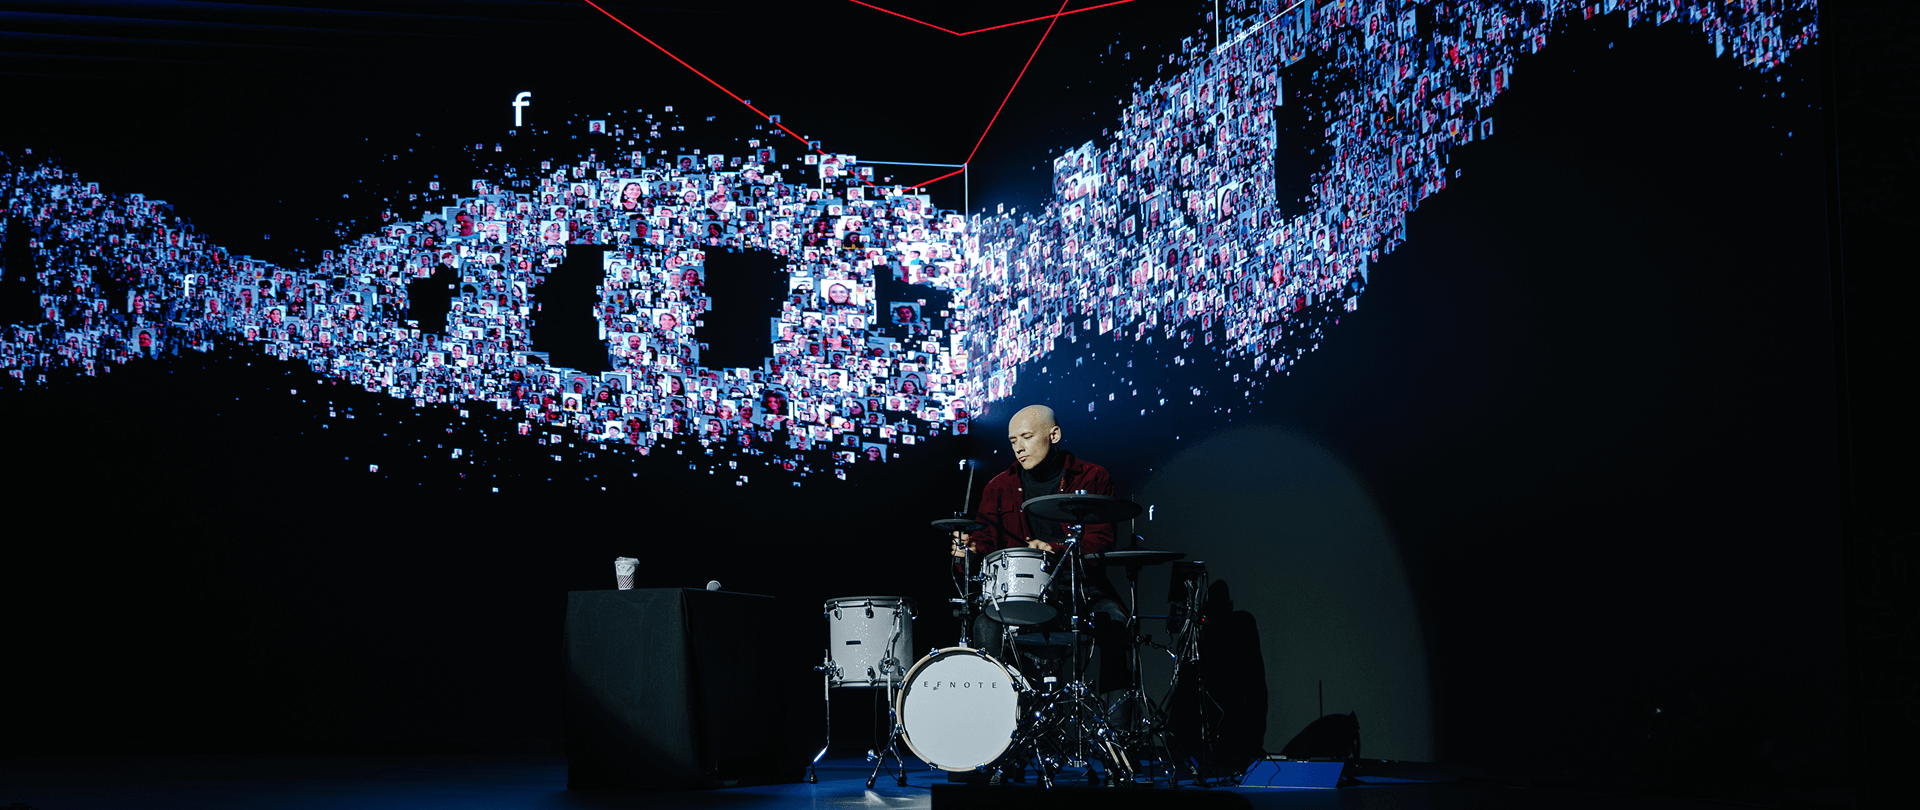
The main challenge was ensuring everything launched correctly and ran smoothly on the festival day. We installed AI models on the PC in advance and tested the digital twin mechanics. The real trial was the performance itself: within minutes, we had to set up the drums on stage, connect them to the PC, and configure all signals so the data would display correctly on the screen during the talk.
Zakhar Zotov
Developer, Akademia
Results
For AkademiaDev, this project was unique. It allowed us to create a meaningful creative statement while refining our use of technologies such as digital twins and real-time visualization. Although we had experimented with a lot of mechanics before, this was the team’s first live performance experience. Throughout the whole timeline of the project, we collaborated with a stage director to properly synchronize the video and live presentation.
In just one week, we delivered a complex creative project that became a key attraction of the event. More than 300 people attended the performance, and throughout the day visitors repeatedly returned to the installation to download their digital reflections.
The festival became a testing ground for new ideas and approaches to data visualization for our team. In large commercial projects, there are often limitations. Here, there were none. The corner screen setup encouraged experimentation. Thanks to the Naked Eye effect, we managed to create an impressive volumetric dashboard with dynamic light sources.
Andrey Rodimtsev
Head of Projects, AkademiaDev